Here is your paragraph on the summer season of India !
Period from March to June is called the summer season. High temperature and low humidity are the chief character sties of this season.
Hence it is also known as hot weather season or hot dry summer season. Sometimes, it is referred to as pre-monsoon period.
(a) Temperature:
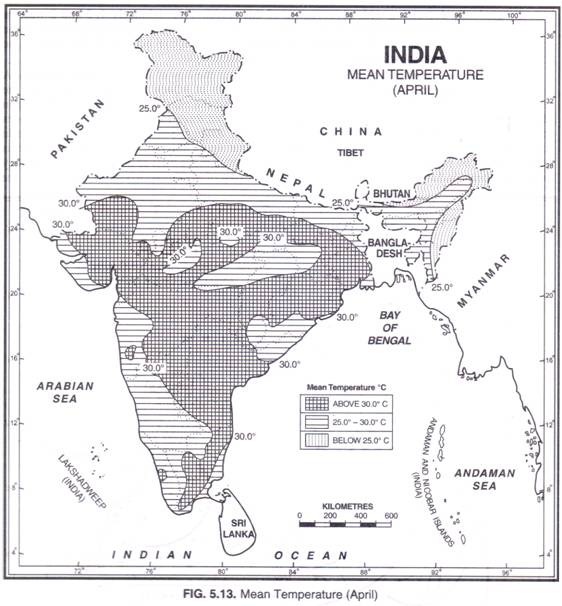
As the season advances, sun’s vertical rays move northwards and large parts of the country, south of the Satpura range, are heated up. There is a progressive northward march of warmth as the sun proceeds towards the north, the southern parts being distinctly warmer in March and April whereas in June, north India has much higher temperatures.
ADVERTISEMENTS:
In March, the highest temperatures are nearly 40°C in the southern parts of the Deccan plateau; in April the highest temperature of about 45°C is recorded in the northern parts of Madhya Pradesh; in May the scene of highest temperature shifts to Rajasthan where temperatures as high as 48°C may be recorded and in June the maximum temperature is in Punjab and Haryana.
The highest temperatures so far recorded are 50.5°C at Alwar on 10th May, 1956 and 50.6°C at Ganganagar on 14th June, 1935. The highest temperatures are recorded in May but in certain areas June is the month of the highest temperatures. In fact the highest temperatures are recorded just before the onset of the southwest monsoons. Even the minimum temperature at night rarely falls below 20°C mark.
ADVERTISEMENTS:
It ranges from 20° to 25°C over northern and central India and slightly higher in the south with a pocket of over 27°C over central parts of Deccan. The diurnal range of temperature is also very high. It may be as high as 18°C in Rajasthan and adjoining areas of Madhya Pradesh.
However, the maximum summer temperatures are comparatively lower in the southern parts of the country due to moderating effect of the sea. The mean maximum temperature at most places is about 26°-30°C.
The temperatures along the west coast are comparatively lower than those prevailing on the east coast due to the prevailing westerly winds. The large contrast between land and sea temperatures is observed from the closely packed isotherms running more or less parallel to the coast (Fig. 5.13).

Most of the heat waves develop over Rajasthan, Punjab and Haryana. This is due to the location of these areas far away from the sea. From here they spread over Uttar Pradesh and Bihar. The strong north westerly winds with a long land trajectory over hot regions check the onward march of the sea breeze over eastern coastal belt and create heat wave conditions over coastal Orissa and Andhra Pradesh.
The heat waves start striking by the end of April and their maximum occurrence is in May and June till the onset of southwest monsoon. The normal duration of heat waves is 4 to 5 days. However, heat waves are rare over the peninsula south of 13°N latitude due to maritime conditions prevailing there.
(b) Pressure and Winds:
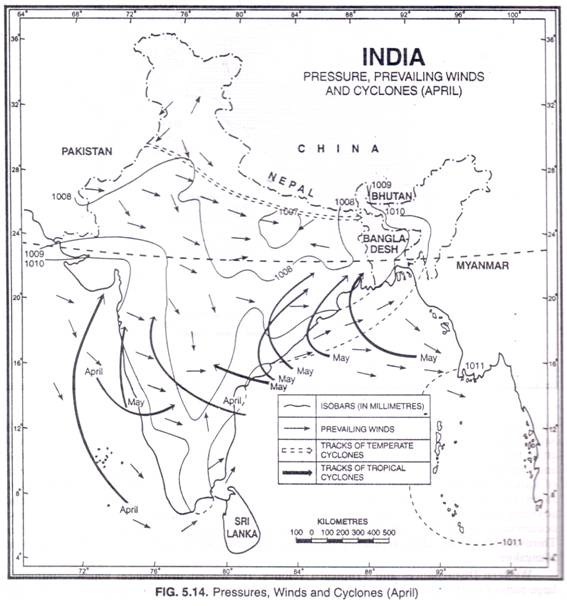
The atmospheric pressure is low all over the country due to high temperature. Unusually low pressure is noticed in north-west India where temperatures are exceptionally high. The overall pressure gradient is low.
ADVERTISEMENTS:
The difference of pressure between the extreme north and south of the country does not exceed 3-4 mb. The isobars run more or less parallel to the coast indicating differences in pressure conditions over land and sea.
There is marked change in the direction and speed of the winds from the winter conditions. The winds are by and large light and variable. However, there are some exceptions. In May and June, high temperature in northwest India builds steep pressure gradient which is often of the order of 1.0 to 1.5 mb per degree of latitude. Under such conditions, hot, dust laden and strong wind known as loo blows.
Loo normally starts blowing by 9.00 A.M., increases gradually and reaches maximum intensity in the afternoon when the temperature is maximum. It blows with an average speed of 30-40 km per hour and persists for days together; often 3 to 10 days at a stretch.
ADVERTISEMENTS:
The strong dust storms resulting from the convective phenomena are locally known as andhis which literally mean blinding storms. They are essentially thunderstorms, which move like a solid wall of dust and sand. The wind velocity often reaches 50-60 kms. per hour and the visibility is reduced to a few metres; sometimes the visibility is nil.
Such dust storms are common in Rajasthan, Haryana, Punjab, Jammu region, Delhi, Uttar Pradesh, Bihar and Madhya Pradesh. They are invariably short lived but the squall and showers which follow these storms bring down the temperature sharply and afford much needed relief, although temporary, from the scorching heat.
The strong convectional movements with divergence related to the westerly jet stream or westerly disturbances in the upper troposphere lead to thunderstorms in eastern and north-eastern part of the country. They normally originate over Chota Nagpur plateau and are carried eastwards by westerly winds.
The areas with highest incidence of thunderstorms are Assam, Arunachal Pradesh, Nagaland, Mizoram, Manipur, Tripura, Meghalaya, West Bengal and the adjoining areas of Orissa and Jharkhand. In West Bengal and the adjoining areas of Jharkhand, Orissa and Assam, the direction of squalls is mainly from the northwest, and they are called norwesters.
ADVERTISEMENTS:
They are often very violent with squall speeds of 60 to 80 km per hour. Hailstones sometimes accompany showers and occasionally attain the size of a golf ball. They cause heavy damage to standing crops, trees, buildings, livestock and even lead to loss of human lives.
The period of maximum occurrence of these storms is the month of Vaisakh (mid-March to mid-April) and hence, they are locally known as Kalabaisakhis, the black storms or a mass of dark clouds of Vaiasakha. In the south the thunderstorms occur in Kerala and adjoining parts of Karnataka and Tamil Nadu, particularly during evenings and nights. The highest occurrences are in the extreme south-western tip with seasonal incidence of 38 days over Thiruvananthapuram. This frequency gradually decreases northwards and is only 14 days at Mangalore.
Western Disturbances and Tropical Cyclones:
The western disturbances which influence large parts of north-west and north India during the winter season still persist with their frequency and intensity gradually decreasing with advancement of this season.
Approximately 4, 3 and 2 western disturbances visit north-west India in March, April and May respectively. These disturbances cause changes in weather conditions by bringing cloudiness and convective activity in this part of the country. They also cause snowfall in higher reaches of the Himalayas.
This is also the season of tropical cyclones originating in the Bay of Bengal and Arabian Sea. A few cyclones are formed in the Bay of Bengal in the month of March but they do not affect the mainland of India. Their frequency rises steeply in April and the number of cyclones originating in May is more than double than those originating in April.
About three-fourths of the tropical cyclones are born in the Bay of Bengal and the rest originate in the Arabian Sea. Most of the depressions in April originate to the south of 10° N while those originating in May are born to the north of this latitude. About 60 per cent of the storms of this season initially move west or north-west but later they re-curve northeast and strike Bangladesh and the Arakan Coast of Myanmar.
About 30 per cent of the storms cross the Indian coast and a few dissipate over the sea itself. The whole of the east coast of India, the coastal areas of Bangladesh and Arakan Coast of Myanmar are liable to be hit by tropical storms in May. Many of them are quite severe and cause heavy damage to life and property.
In the Arabian Sea, major storms are formed in May between 7° and 12° N latitudes. About 75 per cent originate to the west of 70° E longitude and move away from the Indian coast in a north-westerly direction and dissipate in the sea. About 25 per cent originate close to the Indian coast. They move towards the north-east and hit somewhere along the west coast of India.
(c) Precipitation:
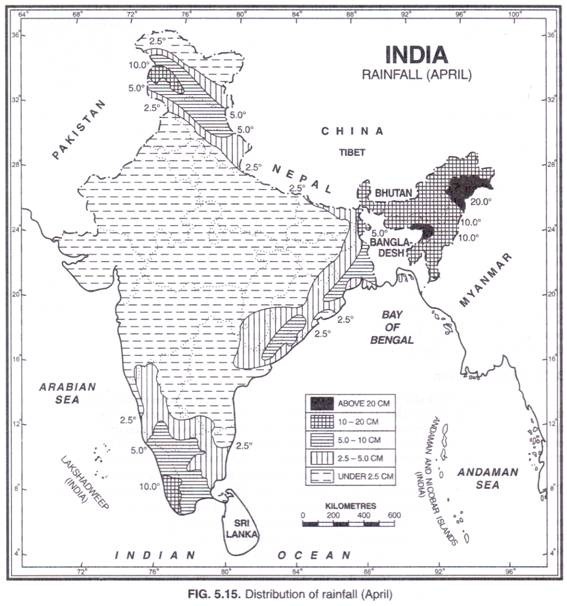
As mentioned earlier, this is a dry season. But this is not a totally rainless season although only one per cent of the annual rainfall of India is received during this season. In the northeastern parts of the country, dust storms bring little rainfall.
Rajasthan, Gujarat and Madhya Pradesh receive less than 2.5 cm rainfall during this season. The precipitation in Kashmir is mainly in the form of snow or sleet in March and early April and is caused by western disturbances. Higher reaches more than 5,000 metre above sea level experience snowfall even in May.
These disturbances move eastwards and cause snowfall or thunderstorms in central and eastern Himalayas till the end of April. The norwesters bring about 50 cm of rainfall in Assam and about 10 cm in West Bengal and Orissa. The intensity of rainfall is high. Often as much as 5 cm of rain is recorded in one hour but the rainfall is short lived.
The rainfall brought by the norwesters is known as the spring storm showers. In Assam the rainfall received in May is about two-thirds of the rainfall received in June. This small amount of rainfall is very useful for the cultivation of tea, jute and rice and is known as tea showers in Assam.
Coastal areas of Kerala and Karnataka receive about 25 cm of rainfall from thunderstorms. These thunderstorms also cause about 10 cm of rainfall in the interior of south India. Such showers are called mango showers in Tamil Nadu and Andhra Pradesh because they are very beneficial to mango crop. In Karnataka they are called cherry blossoms due to their salutary effect on the coffee plantations. The distribution of summer rainfall is shown in Fig. 5.15.

